
Data Analytics

- 3 Assured Interviews
- Eligibility: Graduate
- Duration: 5 Months
- 5-month Core Foundation of Data Science
- 3-month Specialization : AI/ML or Data Engineering
- 180+ live hours in total of Expert-led sessions
We respect your privacy. Your data is secure and will only be used to contact you about Hero Vired programs By filling this form, you agree to our Terms and Conditions

Module 1: Foundations of Data & Programming
After completing this module, you will be able to explain core analytics concepts, differentiate between types of analytics, and apply foundational math and programming logic to support analytical thinking.
Understand the role of data in business decision-making
Distinguish between descriptive, diagnostic, predictive, and prescriptive analytics
Apply the CRISP-DM framework to structure analytics workflows
Solve basic problems using concepts from linear algebra, calculus, and statistics
Write simple algorithms and control flows in code
Module 2: Data Analysis Using Excel
After completing this module, you will be able to analyze and manipulate datasets, build dynamic reports, and automate repetitive tasks in Excel.
Use Excel functions, pivot tables, and lookups for business insights
Create dashboards and data storytelling reports
Automate tasks with Macros and user forms
Write basic VBA code with loops, variables, and conditional logic
Module 3: Databases & Querying with SQL
After completing this module, you will be able to query, combine, and transform data in relational databases using SQL.
Write queries using SELECT, JOINs, nested queries, and window functions
Perform data transformations with GROUP BY, HAVING, and filters
Understand schema design, normalization, and relationships
Module 4: Data Visualization Using Power BI
After completing this module, you will be able to design interactive dashboards, apply DAX for calculations, and publish reports in Power BI Service.
Connect and clean data from multiple sources
Build data models and perform advanced calculations with DAX
Create compelling dashboards and visual narratives
Implement Row-Level Security and publish reports
Module 5: Python for Data Analysis
After completing this module, you will be able to write Python programs, manipulate data with Pandas and NumPy, and visualize insights with Matplotlib.
Write and debug Python code with loops, functions, and conditionals
Work with lists, dictionaries, tuples, and other data structures
Clean, filter, and merge datasets using Pandas
Generate plots and statistical visualizations with Matplotlib
Module 6: Statistics for Data Science
After completing this module, you will be able to apply statistical methods to make inferences, test hypotheses, and interpret data distributions.
Conduct t-tests, ANOVA, and Chi-Square tests
Interpret confidence intervals, p-values, and effect sizes
Apply probability distributions to solve business problems
Module 7: Applied Business Analytics
After completing this module, you will be able to analyze business challenges using frameworks and deliver data-backed recommendations.
Apply SWOT, PESTLE, and value chain analysis
Translate business objectives into analytical questions
Recommend solutions using structured, data-driven insights
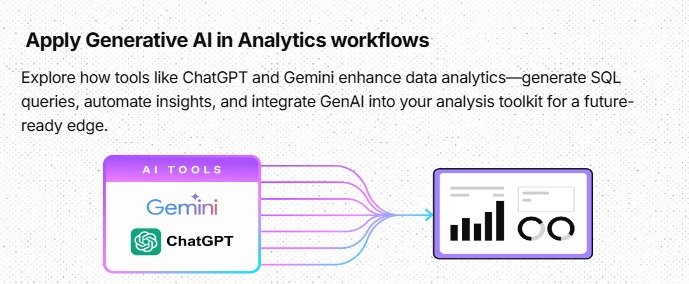
Module 8: Next-Gen Analytics – GenAI for Data Analysis
After completing this module, you will be able to use GenAI tools to generate code, query data conversationally, and automate analytics tasks.
Use ChatGPT, Gemini, and similar tools for querying and code assistance
Automate Python code generation, optimization, and debugging
Explore GenAI use cases in data-intensive business environments
Module 9: Agile Project Management for Analytics
After completing this module, you will be able to manage analytics projects using Agile methodologies and foster stakeholder collaboration.
Explain Agile principles and their relevance in analytics projects
Plan sprints, define user stories, and allocate tasks
Monitor progress and adapt plans through iterative feedback
Module 10: Capstone Project
After completing this module, you will be able to design and deliver an end-to-end analytics solution to a real-world business problem.
Define a business problem and frame it analytically
Use tools to extract, clean, analyze, an d visualize data
Present insights effectively through dashboards and storytelling frameworks
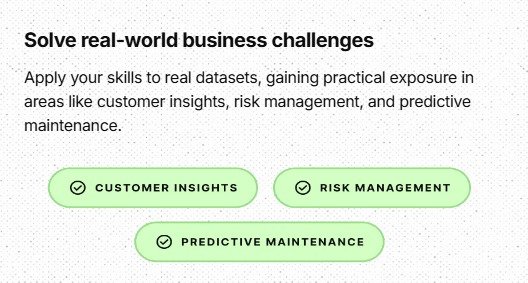
Leverage data-driven insights to predict customer loyalty, minimize churn, and boost sales. Gain hands-on experience with real-world datasets, mastering advanced analytics techniques to enhance retention, identify opportunities, and accelerate growth effectively.
Analyze loan portfolios to improve risk management strategies using SQL, Power BI, and Excel. Identify high-risk loans, streamline approval processes, and enhance financial outcomes through data-driven insights, improving creditworthiness evaluations and decision-making frameworks.
Utilize advanced data analytics to predict machine breakdowns and recommend proactive maintenance schedules. Use SQL and Power BI to enhance operational efficiency, reduce repair costs, increase equipment lifespan, and ensure seamless Tesla operations.
Analyze customer behavior on Amazon using SQL, Power BI, and Excel to uncover trends and product performance insights. Optimize marketing strategies, enhance customer experiences, predict preferences, and drive sustainable business growth effectively.
Analyze Airbnb listings with Power BI to uncover trends in pricing, occupancy, and reviews. Deliver actionable insights that help optimize host strategies, improve guest experiences, increase satisfaction, and maximize overall revenue.
Optimize SwiftLogistics’ supply chain operations by identifying inefficiencies with SQL and Power BI. Improve lead times, lower transportation costs, enhance delivery performance, and increase customer satisfaction through actionable data insights.
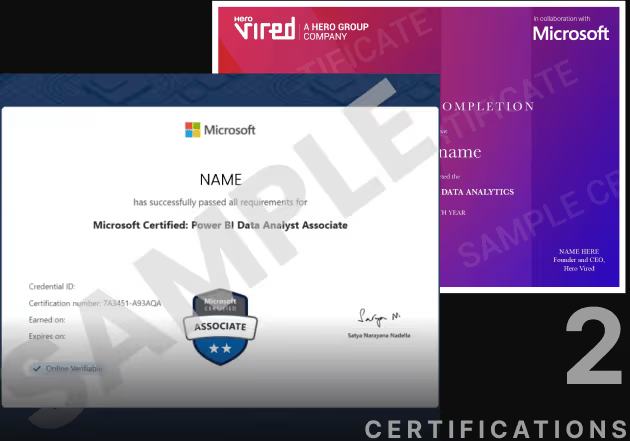
On successful completion of the program, you will be eligible for the Hero Vired certificate that places you in an elite league of professionals.
Additional PL-300: Microsoft Power BI Data Analyst Certificate (Subject to the learner clearing the certification examination)
- I’m new to data analytics—can I keep up? Yes, the course is designed for absolute beginners. It starts from the fundamentals and gradually builds up your skills, much like learning to drive. You’ll begin with no prior knowledge and progress toward confidently navigating real-world data challenges. The curriculum covers the basics of data analytics, introduces tools like Excel, SQL, and Tableau, and helps you develop critical thinking to solve practical problems. You’ll also work on hands-on projects to build your portfolio and gain experience.
- Will the program overwhelm me with too much information? No, the learning path is structured to be gradual and supportive. You’ll receive guidance at every step, with checkpoints to reinforce your understanding.
- Is this program theoretical or practical? It’s highly practical. You’ll work with real datasets, engage in sandbox labs, and apply your skills to business case projects.
- I’ve never coded before. Will I struggle? Not at all. Coding is introduced in a beginner-friendly way, with guided exercises and AI-powered tools to assist you, including help with generating SQL queries.
- Will I learn how to handle data sets? Yes, you’ll learn how to clean, transform, and visualize both structured and unstructured data, preparing it for analysis.
- What’s Exploratory Data Analysis (EDA), and why is it important? EDA is the process of exploring data to uncover patterns, spot anomalies, and prepare it for deeper insights. It’s a key step in data storytelling and decision-making.
- Is there a final project? Yes, the course includes a capstone project where you’ll apply everything you’ve learned to solve a real-world business problem.
CERTIFICATE PROGRAM
Data Analytics
IN COLLABORATION WITH
Microsoft
EMI starts at ₹4,100/month
Total Price: ₹1,20,000 + GST
Easy monthly payments & scholarships available